For both sides
Cannabis benchmarks: cost per pound, basket size, margins
Federal and state law current as of September 2026 — verify with counsel.
Useful cannabis benchmarks in 2026 are dated and sourced. Headset's average dispensary basket was $47.29 for the year ending June 2026, with a 26% average discount rate. Public growers reported production costs from $122 per pound in a California greenhouse to $670 per pound indoors in New Jersey, against a national wholesale spot index near $1,088 per pound.
Key takeaways
- Headset measured an average dispensary basket of $47.29 and 2.74 items per basket across its tracked markets for the 12 months ending June 2026, down 5.5% year over year.
- Headset put the median store's retail gross margin at 42.7% in 2025, down from 52.6% in 2021, as reported by Cova.
- Grown Rogue reported indoor flower costs of $277 per pound in Michigan, $326 in Oregon, and $670 in New Jersey for the quarter ended 30 June 2026.
- Glass House Brands reported greenhouse production cost of $122 per equivalent dry pound and an average selling price of $211 per pound for the second quarter of 2026.
- Only 27.3% of operators told Whitney Economics they were profitable in its June 2024 survey, so an average cannabis business is not a healthy benchmark.
How to read a cannabis benchmark
A benchmark is only useful if you know who measured it, when, and in which state. Cannabis cannot lawfully cross state lines, so there is no national market. There are dozens of sealed state markets with different prices, taxes, and license counts. A cost per pound that is excellent in New Jersey loses money in Oregon.
Three rules keep you out of trouble:
- Date everything. Prices in mature states have fallen by half or more since 2021. A 2021 benchmark describes a different industry.
- Match the state and the license model. Compare a Michigan store with Michigan data. Whether the state caps licenses matters more than almost anything else; see limited-license vs open-market states.
- Ask what is inside the number. “Cost per pound” with no rent, no overhead, and trim counted as output is not comparable to a fully loaded figure from a public filing.
The tables below use regulator data, public-company filings, and named data vendors. Where a figure is trade commentary rather than a measurement, it is labeled. This is educational material, not tax, legal, or valuation advice for any particular business.
Cultivation: what does it cost to grow a pound?
Reported, fully loaded costs in mid-2026 ran from about $120 per pound in a very large California greenhouse to about $670 per pound in a new indoor facility in New Jersey. The most useful public data comes from two companies that publish the figure every quarter.
| Operator and state | Grow type | Cost per pound | Selling price per pound | Period |
|---|---|---|---|---|
| Glass House Brands, California | Greenhouse, very large scale | $122 per equivalent dry pound | $211 average | Q2 2026 |
| Grown Rogue, Michigan | Indoor | $277 | $615 bulk | Q2 2026 |
| Grown Rogue, Oregon | Indoor | $326 | $592 bulk | Q2 2026 |
| Grown Rogue, New Jersey | Indoor, newer facility | $670 | $2,077 packaged | Q2 2026 |
Read these with care. Glass House sells mostly biomass and bulk flower from millions of square feet of greenhouse, so both its cost and its price sit far below indoor figures. Its cost also moves with the season: it reported $91 per pound in the second quarter of 2025 and $122 a year later. Grown Rogue’s numbers are for craft-grade indoor flower, and the company is widely regarded as a low-cost producer, so treat its Michigan and Oregon figures as a good operator’s result rather than a typical one.
Trade commentary usually puts indoor production at roughly $400 to $900 per pound and outdoor at $150 to $300. Those ranges are not surveys. A seller whose books support a fully loaded indoor cost under $400 in a mature state is in a small group.
The margin test buyers run
The benchmark that matters is the spread between cost and the local wholesale price, and how much price decline it can absorb.
Illustrative, using the reported Michigan figures: a selling price of $615 less a cost of $277 leaves $338 per pound, a 55% margin. If the bulk price fell 25% to about $461, the margin would still be $184. Now take a grower in the same state with a cost of $550. Today’s spread is $65. The same 25% price drop puts that grower $89 underwater on every pound. Both businesses may show a profit on last year’s tax return. Only one is financeable.
You can run the same test on your own numbers with the cultivation cost-per-pound calculator. How buyers turn the result into a price is covered in cultivation valuation per square foot and per pound.
Wholesale flower prices in 2026
The national reference is the Cannabis Benchmarks U.S. Spot Index, which stood at $1,088 per pound on 4 September 2026. That average blends high-priced limited-license states with oversupplied ones, so state data matters more.
| Market | Price point | Date | Source |
|---|---|---|---|
| U.S. composite | $1,088 per pound wholesale spot | 4 Sep 2026 | Cannabis Benchmarks |
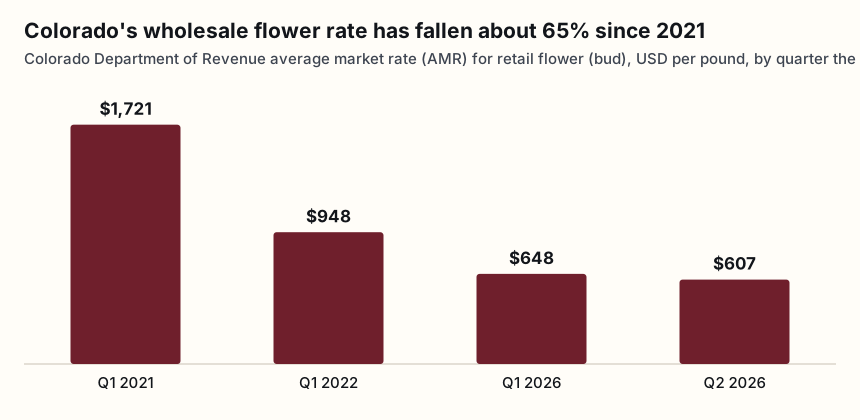
| Colorado | $607 per pound state average market rate for retail flower | Apr to Jun 2026 | Colorado Department of Revenue |
| Michigan | $615 per pound bulk indoor, one producer’s realized price | Q2 2026 | Grown Rogue |
| Oregon | $592 per pound bulk indoor, one producer’s realized price | Q2 2026 | Grown Rogue |
| Michigan retail | $58.18 per ounce average adult-use flower at the register | Jun 2026 | Cannabis Regulatory Agency data via trade press |
One comparison shows how far the spread runs. Michigan’s average retail ounce at $58.18 works out to about $931 per pound at the register, tax-exclusive. That is below the national wholesale index. A Michigan grower and a New Jersey grower are in different businesses.
The longer price series for Colorado, Michigan, Oregon, and Massachusetts, and what they do to value, are in how oversupply and price compression affect value.
Yield per square foot
Yield is the other half of cost per pound, because most cultivation cost is fixed. Consultant Ryan Douglas put the commercial floor at 30 to 35 grams of dry flower per square foot of canopy per harvest, with 50 to 70 grams marking strong operations (Greenhouse Grower, November 2020).
Current public data sits at the top of that range or above it. For the quarter ended 30 June 2026, Grown Rogue reported total yields of 90 grams per square foot in Michigan, 76 in Oregon, and 61 in New Jersey, with top-grade “A” flower at 56, 53, and 41 grams respectively. The gap between total yield and A-grade yield matters. Only A-grade flower earns the headline price. The rest sells as smalls or trim at a fraction of it.
When a seller quotes yield, ask three things: per harvest or per year, per square foot of flowering canopy or of the whole building, and total weight or A-grade only. Then tie the answer to harvest records in the track-and-trace system.
Retail: basket size, items, and discounts
Headset’s point-of-sale data is the most widely cited retail benchmark. For the 12 months ending June 2026, across the state markets it tracks:
| Metric | Figure | Change year over year |
|---|---|---|
| Average basket | $47.29 | Down 5.5% |
| Items per basket | 2.74 | Not reported |
| Transactions | 473.8 million | Up 6.5% |
| Units sold | 1.42 billion | Up 5.5% |
| Dollar sales | $24.3 billion | Up 0.8% |
| Average item price (June 2026) | $15.91 | Not reported |
| Average discount rate (June 2026) | 26.0% of shelf value | Not reported |
| Average eighth of flower (June 2026) | $20.64 | Not reported |
The pattern is the story of mature cannabis retail. Traffic and units are up more than 5%. Dollars are flat. Customers are buying more product for less money per trip, and stores are giving away a quarter of shelf value in discounts to keep them.
What sells
Category mix drives margin, because flower is the most price-compressed category. Headset’s shares for the same 12 months: flower 39.4%, vapor pens 25.3%, pre-rolls 15.8%, edibles 11.9%, concentrates 5.0%, and beverages 1.2%. Pre-rolls grew 10.1% and concentrates fell 7.7%. A store whose mix leans to vapes, pre-rolls, and edibles generally holds margin better than a flower-heavy store in the same town.
Turning basket size into store revenue
Illustrative: a store averaging 300 transactions a day at the Headset basket of $47.29 takes in about $14,187 a day, or roughly $5.18 million a year. At 200 transactions it is about $3.45 million. A buyer will rebuild revenue this way from point-of-sale data, then compare it with state track-and-trace sales and bank deposits. If the three do not agree, diligence slows down. The revenue checks are covered in how to evaluate a cannabis business for sale.
Margins: gross, EBITDA, and after-tax
Retail gross margin
Headset’s model of the median store put retail gross margin at 42.7% in 2025, down from 52.6% in 2021, as reported by Cova. Nearly ten points of margin disappeared in four years, mostly through discounting and price competition.
Apply it to the illustrative $5.18 million store: gross profit is about $2.21 million at 42.7%. At the 2021 margin it would have been about $2.72 million. The half-million-dollar difference comes straight out of earnings, because rent and payroll did not fall with it.
Vertically integrated operators
Public multi-state operators report higher blended margins because they keep the cultivation and manufacturing margin on products sold through their own stores. Trulieve reported a 60% gross margin and a 36% adjusted EBITDA margin for 2025. Curaleaf reported a 50% adjusted gross margin and a 22% adjusted EBITDA margin. These are not fair comparisons for a standalone store or a standalone grow. They are a fair comparison for a vertically integrated group in a limited-license state.
Wholesale growers show how volatile margin is. Glass House’s gross margin was 55% in the second quarter of 2025, 14% in the first quarter of 2026, and 34% in the second quarter of 2026. One quarter of a grower’s results tells you very little.
After-tax margin and 280E
Pre-tax margins overstate what an adult-use owner keeps. Under IRC 280E, a business trafficking in a Schedule I substance can deduct cost of goods sold but not rent, payroll, or marketing. Adult-use marijuana remains Schedule I after the April 2026 order that moved state-licensed medical marijuana to Schedule III, so adult-use retail still pays tax on something close to gross profit.
Headset estimated that the typical dispensary would save about $268,000 a year in federal tax without 280E, based on a model of the median store across 24 state markets. That figure is a useful benchmark for the size of the 280E burden on one ordinary store. How to recast an income statement for it is covered in cannabis financial statements under 280E.
How many operators make money at all?
Fewer than you would think. In Whitney Economics’ June 2024 business conditions survey, 27.3% of operators said they were profitable, 40.6% were breaking even, and 32.2% were losing money. The profitable share was 42.4% in 2022. The survey compared that with a 65.3% profitability rate for U.S. small businesses generally.
For a seller, this is good news if you are in the profitable group. Buyers are looking at a field where most targets do not earn money, so documented, repeatable profit is scarce and commands attention.
Which benchmarks move sale price the most?
Buyers weigh a handful of numbers far more heavily than the rest.
| License type | Benchmark buyers check first | Why it moves price |
|---|---|---|
| Cultivation | Fully loaded cost per pound against current local wholesale | Shows whether the facility survives the next price drop |
| Cultivation | A-grade yield per square foot of canopy | Fixed costs spread over saleable output |
| Retail | Transactions per day and basket trend over 24 months | Separates a traffic problem from a pricing problem |
| Retail | Gross margin after discounts | Discounting hides inside a healthy-looking top line |
| Retail | Rent as a share of revenue | Non-deductible under 280E for adult-use sales |
| Manufacturing | Input cost per gram of output and yield from biomass | Commodity distillate pricing leaves little room |
| All | After-tax cash flow, with and without 280E | This is what services acquisition debt |
If your numbers beat the benchmark, document it before you go to market: monthly cost-per-pound schedules, point-of-sale exports, and reconciliations to the state system. If they trail it, know why, and know whether a buyer could fix it. Both cases are part of preparing a cannabis business for sale. The way these inputs become a price is laid out in cannabis business valuation and, for stores, in dispensary valuation multiples.
Where to get current data for your state
- State regulators. Michigan’s Cannabis Regulatory Agency publishes monthly price and sales reports. Oregon’s OLCC publishes harvest, price, and sales data. Colorado’s Department of Revenue sets quarterly average market rates. Massachusetts’s Cannabis Control Commission runs an open data platform.
- Public-company filings. Quarterly releases from growers that report cost per pound, and from multi-state operators that report gross and EBITDA margins, are free and audited or reviewed.
- Data vendors. Headset for retail point-of-sale metrics and Cannabis Benchmarks for wholesale prices. Summary figures are public; state-level detail is paid.
- Your own systems. Point-of-sale and track-and-trace exports are the benchmark a buyer trusts most, because they can be tied to tax filings and deposits.
If you want to see how your numbers compare before you decide whether to sell, that is a reasonable topic for a confidential intro call.
Frequently asked questions
What is a good cost per pound for indoor cannabis in 2026?
It depends on the state's wholesale price. Grown Rogue, a public indoor grower, reported $277 per pound in Michigan and $326 in Oregon for the second quarter of 2026, which left room against bulk prices near $600. A newer East Coast facility can run far higher and still work because packaged prices there are several times higher. Judge cost against the local selling price, not a national number.
What is the average dispensary transaction size?
Headset reported an average basket of $47.29 and 2.74 items per transaction across its tracked U.S. markets for the 12 months ending June 2026. That was 5.5% lower than the year before, while transaction counts rose 6.5%. Stores in higher-priced limited-license states usually run above that figure and stores in Michigan or Oregon usually run below it.
What gross margin should a dispensary have?
Headset's estimate for the median store was 42.7% in 2025, down from 52.6% in 2021. Vertically integrated operators report higher blended margins because they capture the grower's margin too; Trulieve reported 60% for 2025. A standalone store well under 40% usually has a discounting or purchasing problem that a buyer will price in.
Why do buyers care about cost per pound when the income statement already shows profit?
Because wholesale prices keep moving and last year's profit was earned at last year's prices. Cost per pound tells a buyer how far prices can fall before the facility loses money on every harvest. A grower at $300 per pound survives a market at $500. A grower at $650 does not, whatever the trailing income statement says.
Are national cannabis benchmarks reliable for valuing my business?
Only as a starting point. Cannabis cannot cross state lines, so every state is its own market with its own prices, taxes, and license rules. A national wholesale average near $1,088 per pound sits alongside Colorado's $607 state rate. Use your state's regulator data and your own track-and-trace reports first, and national figures as context.
How is cost per pound calculated?
Divide all cultivation costs for a period by the dry pounds produced in that period. The honest version includes labor, utilities, nutrients, rent or facility depreciation, and allocated overhead, and it counts only saleable output. Two growers can quote very different figures because one leaves out rent or counts trim as pounds, so always ask what is inside the number.
Sources
- Headset — Cannabis Industry Statistics 2026 (12 months ending June 2026) — https://www.headset.io/data/cannabis-industry-statistics
- Cova Software — Cannabis Industry Statistics 2026: Data, Trends and Market Analysis (citing Headset and MJBizDaily/Whitney Economics) — https://www.covasoftware.com/blog/cannabis-industry-statistics-2026-data-trends-market-analysis
- Cannabis Business Times — Typical Dispensary to Save $268K Annually Under Schedule III Reclassification (Headset report) — https://www.cannabisbusinesstimes.com/cannabis-rescheduling/news/15774718/typical-dispensary-to-save-268k-annually-under-schedule-iii-reclassification
- Grown Rogue — Second Quarter 2026 Results (4 August 2026) — https://www.newswire.ca/news-releases/grown-rogue-reports-second-quarter-2026-results-897416630.html
- Glass House Brands — Second Quarter 2026 Financial Results (13 August 2026) — https://www.globenewswire.com/news-release/2026/08/13/3344909/0/en/glass-house-brands-reports-second-quarter-2026-financial-results.html
- Cannabis Benchmarks — U.S. Cannabis Spot Index, 4 September 2026 — https://www.cannabisbenchmarks.com/reports/u-s-cannabis-spot-index-september-4-2026/
- Colorado Department of Revenue — AMRs for retail marijuana effective 1 April 2026 — https://tax.colorado.gov/Marijuana_AMR_April_to_June_2026
- Greenhouse Grower — The 3 G's for Increasing Cannabis Yields, Ryan Douglas (13 Nov 2020) — https://www.greenhousegrower.com/production/the-3-gs-for-increasing-cannabis-yields/
- Whitney Economics — Cannabis Business Conditions Survey: only 27.3% of U.S. operators profitable (PR Newswire, July 2024) — https://www.prnewswire.com/news-releases/whitney-economics-cannabis-business-conditions-survey-results-indicate-only-27-3-of-us-cannabis-operators-are-profitable-302204870.html
- Trulieve — Fourth Quarter and Full Year 2025 Results (26 Feb 2026) — https://investors.trulieve.com/2026-02-26-Trulieve-Reports-Fourth-Quarter-and-Full-Year-2025-Results-with-60-Gross-Margin-and-Record-Cash-Flow-Generation
- Curaleaf — Fourth Quarter and Full Year 2025 earnings release (SEC exhibit) — https://www.sec.gov/Archives/edgar/data/1756770/000175677026000019/q425-exx997xearningsrelease.htm
- Cannabis Business Times — Michigan Cannabis Prices Remain Down, Demand Steady in 2026 — https://www.cannabisbusinesstimes.com/us-states/michigan/news/15819825/michigan-cannabis-prices-remain-down-demand-steady-in-2026-despite-new-tax